Graphs Made Easy
4.1
Size: 3.69 MB
Downloads: 5374
Platform: Windows (All Versions)

Statistics are illustrated much better with graphs. Instead of looking over numbers, it is much easier to look on a chart and see exactly how stocks have risen or declined. If you need to create graphs yourself, you can use Graphs Made Easy. Its name should make it obvious that you can use the application to draw two dimensional graphs without any difficulties. It lets you create various types of graphs and charts and customize them however you want.
You should check your firewall settings before installing the software. The setup wizard will download its contents from the Internet and the firewall may prevent this if your exceptions are not set properly. Graphs Made Easy is freeware and you can install it on most Windows versions in a few moments.
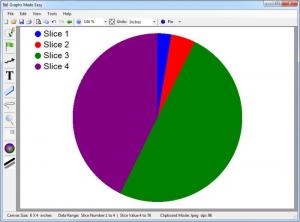
When creating a new project, you can choose to illustrate your graph with lines, areas, bars, series, stacks or opt for a pie chart. Additionally, you may choose to represent the X axis with dates or numbers. The X and Y axes are displayed in the central region of the interface and you can start drawing the graph by inserting numerical values at certain points. You can type your X and Y values on a small window, after clicking one of the options, located on the left edge of the interface. The Enter option, on the same window, will insert the values. The window will not close, so you can add as many coordinates as you want.
As you add new sets of coordinates, the software will automatically unite them with a colored line. It is possible to add new lines and edit their color or associate them with text. If you have multiple lines, you can select one of them from a drop menu, when adding new coordinates. You may also add markers on each axis, set their star values, the interval between them and add text before and after each marker. The markers will be aligned automatically with your inserted coordinates. It is also possible to place a grid over your graph, draw arrows, add labels and more.
Regardless of what type of graph or chart you create, the values are inserted the same way. When you are done, you can save the project as a file, in the software's own format or as an image, in JPEG, BMP, PNG, GIF or EMF format.
Pros
The program lets you customize your graphs however you want. It is possible to add as many values as you need and illustrate them clearly. The options are easy to understand and it will take only a few minutes to adjust to the software.
Cons
You may have some difficulties figuring out how to import data. Graphs Made Easy gives you the possibility of creating professional graphs and charts, with easy to use tools and straightforward functions.
Graphs Made Easy
4.1
Download
Graphs Made Easy Awards

Graphs Made Easy Editor’s Review Rating
Graphs Made Easy has been reviewed by Frederick Barton on 27 Jun 2012. Based on the user interface, features and complexity, Findmysoft has rated Graphs Made Easy 5 out of 5 stars, naming it Essential